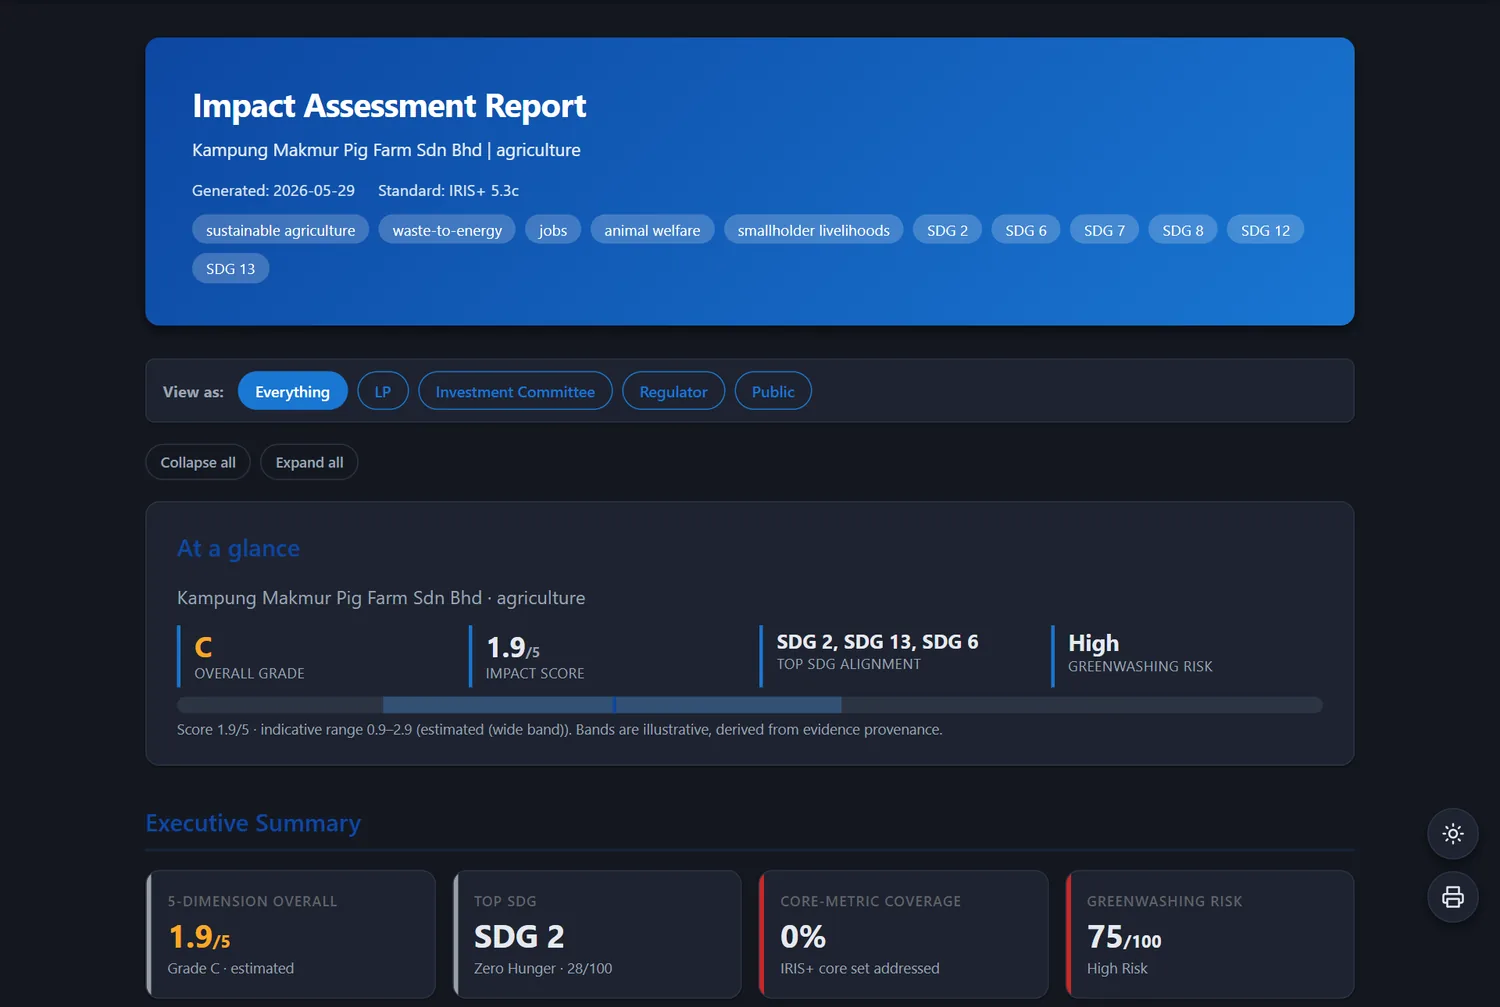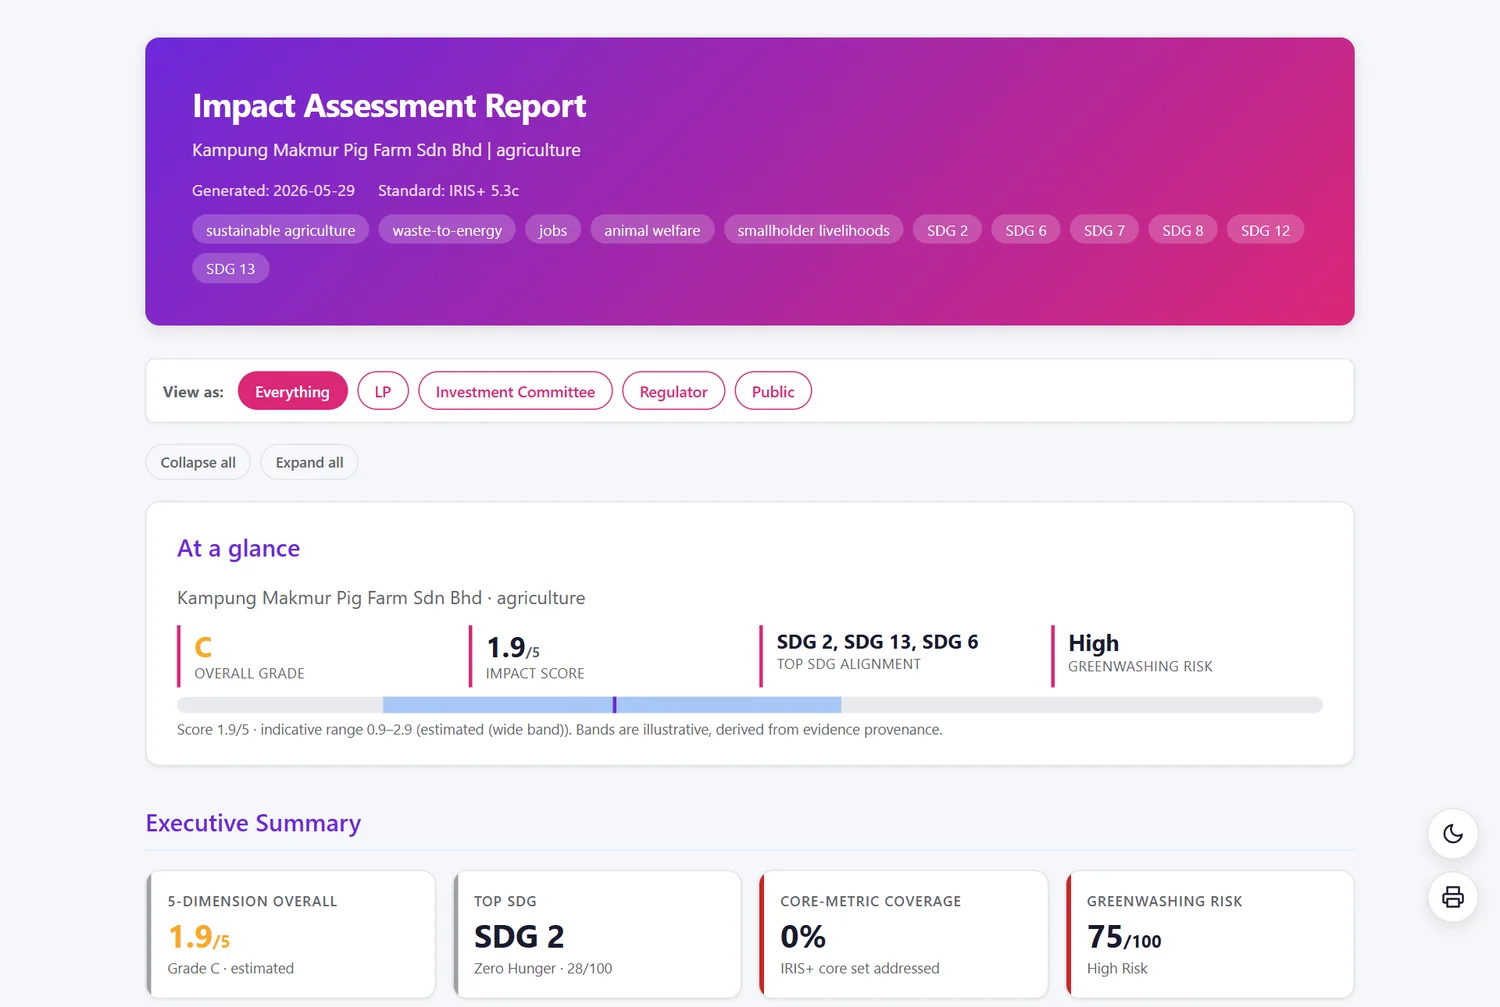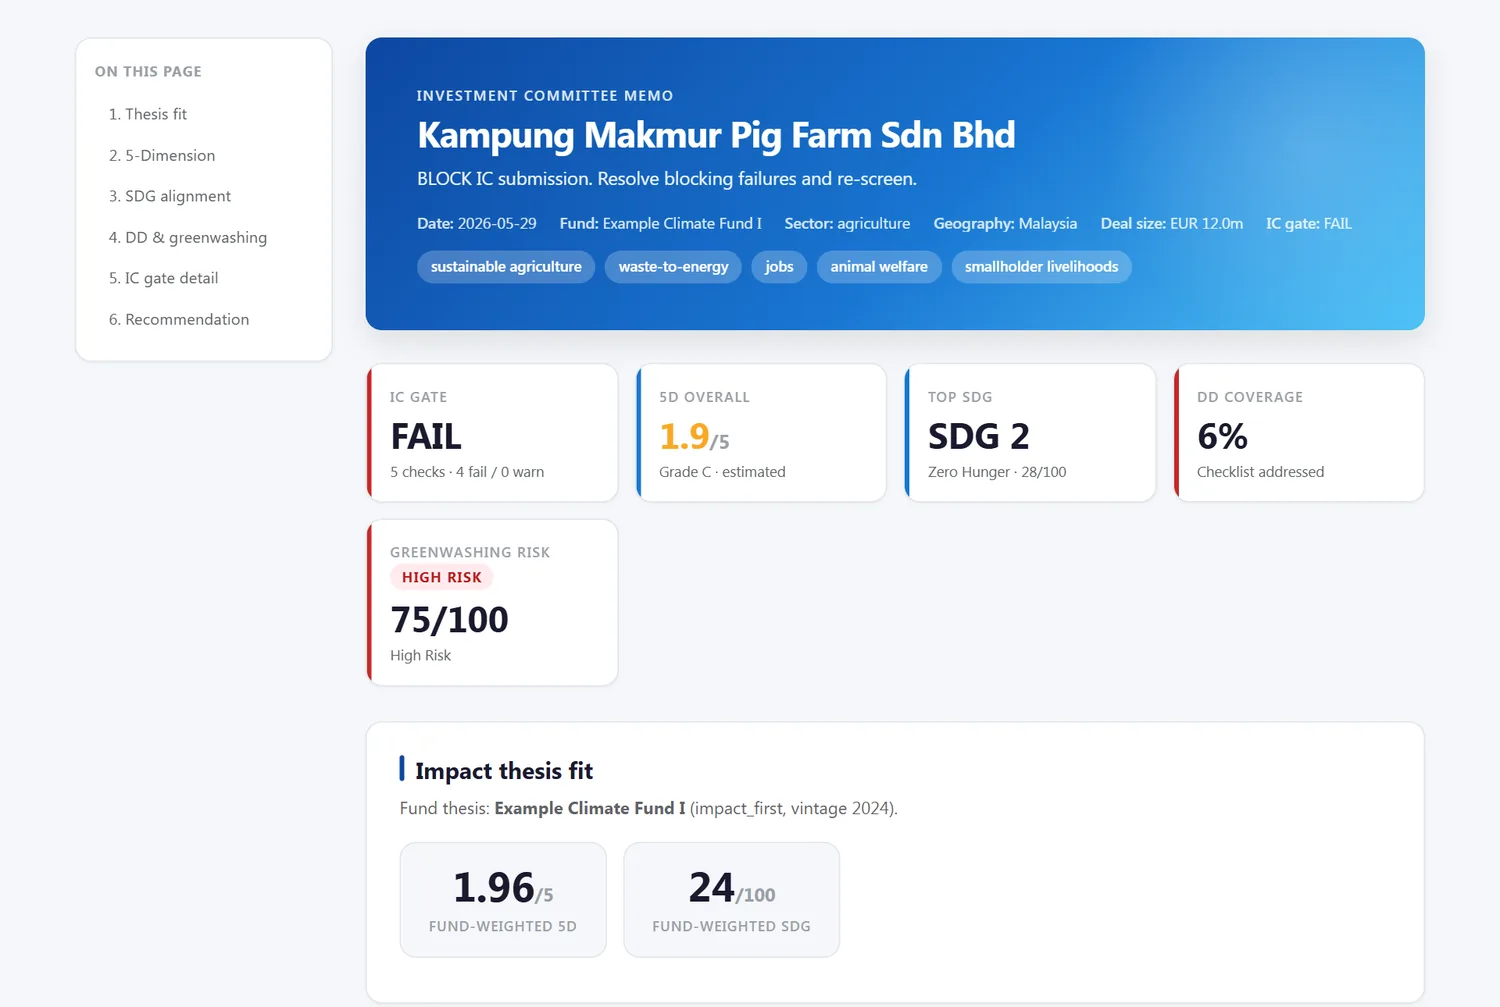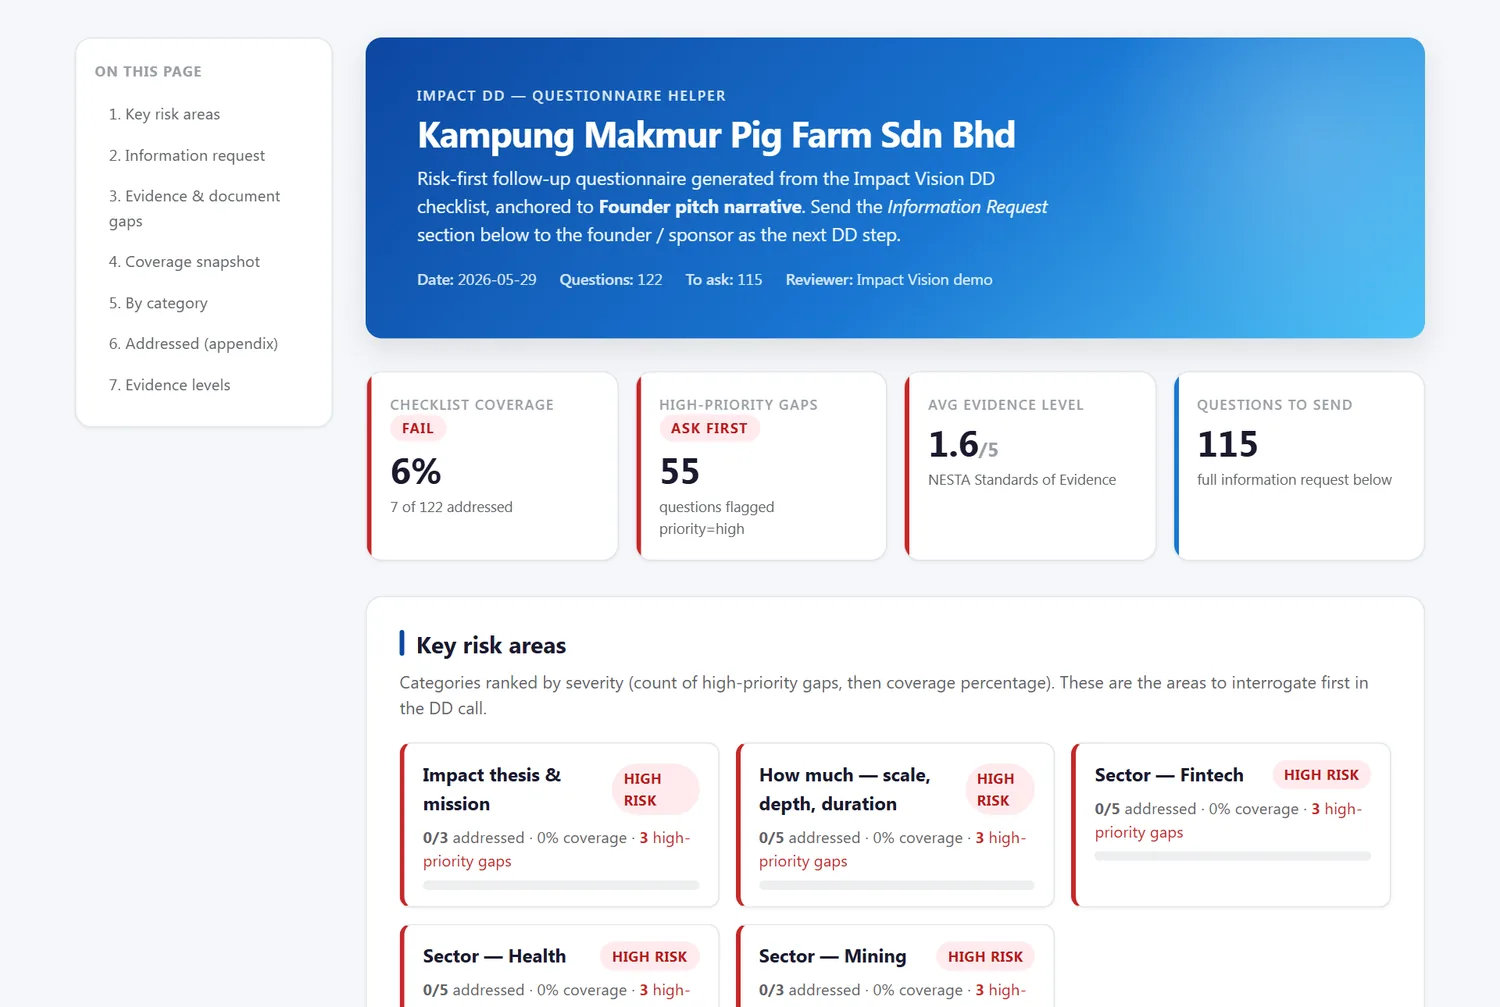
Real output · generated end-to-end

Live samples.
Open them.

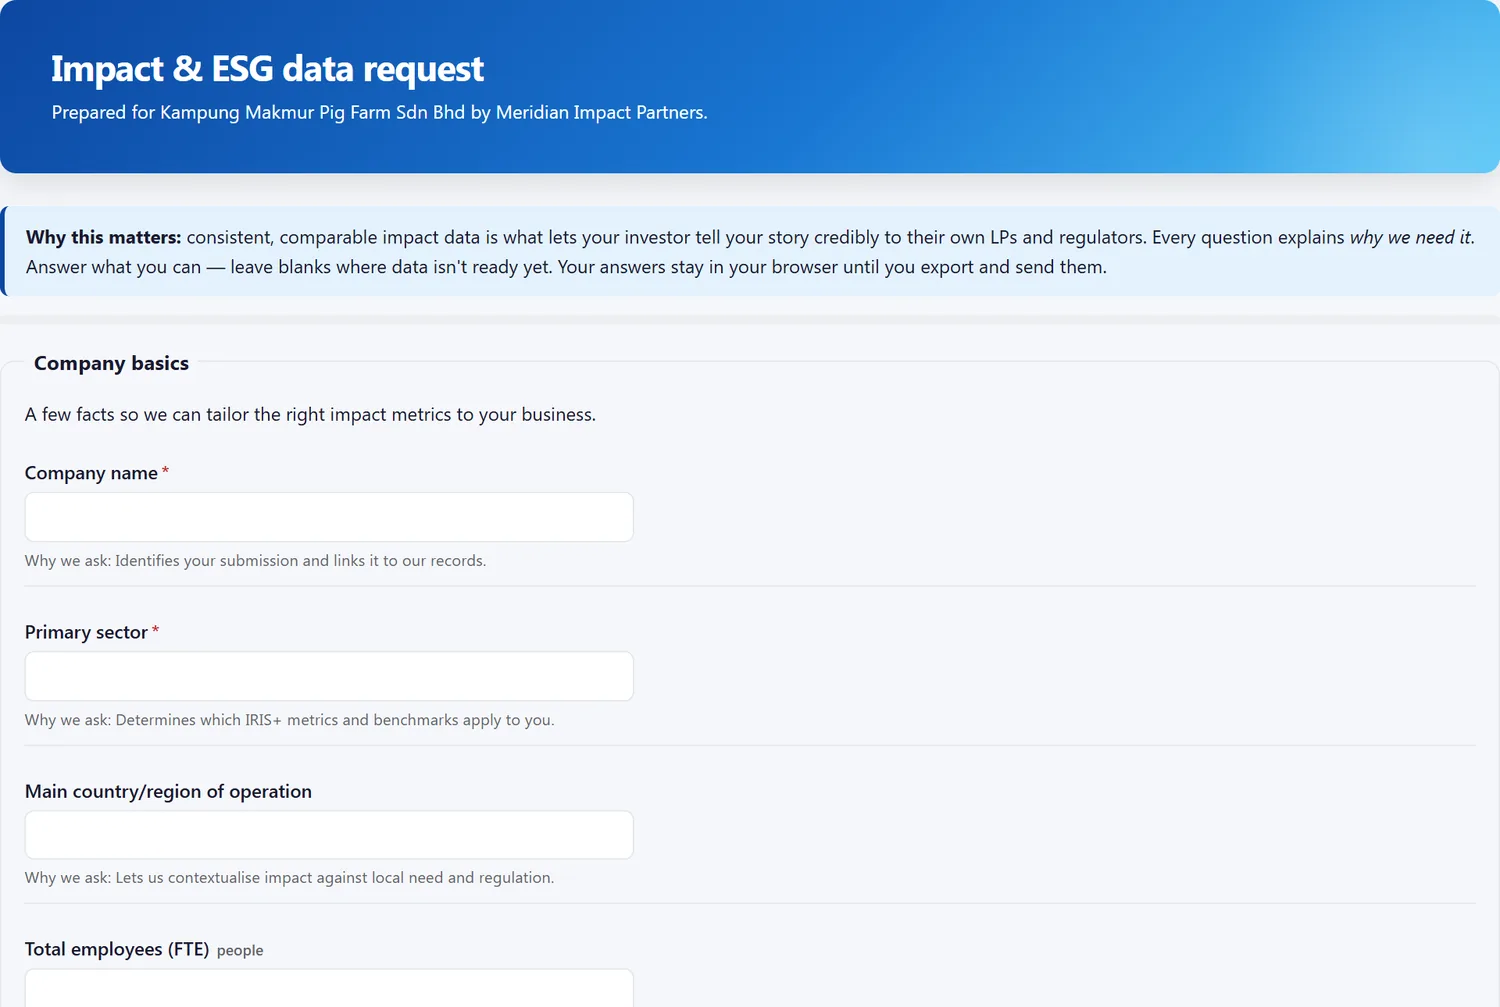
Six deliverables produced by Impact Vision for a single real-world case — a pig farm in Malaysia. An unglamorous, genuinely difficult asset: real emissions, real water and effluent questions, real community exposure, and a legitimate development case. Exactly the sort of deal where a vague impact narrative falls apart.

Nothing here is a mockup. These are the actual files the tool writes, opening in your browser as they would on your machine.

Report internals

Six things a good impact report
refuses to hand-wave.

Each of these is generated, not written by hand — and each one traces back to source text in the input document.

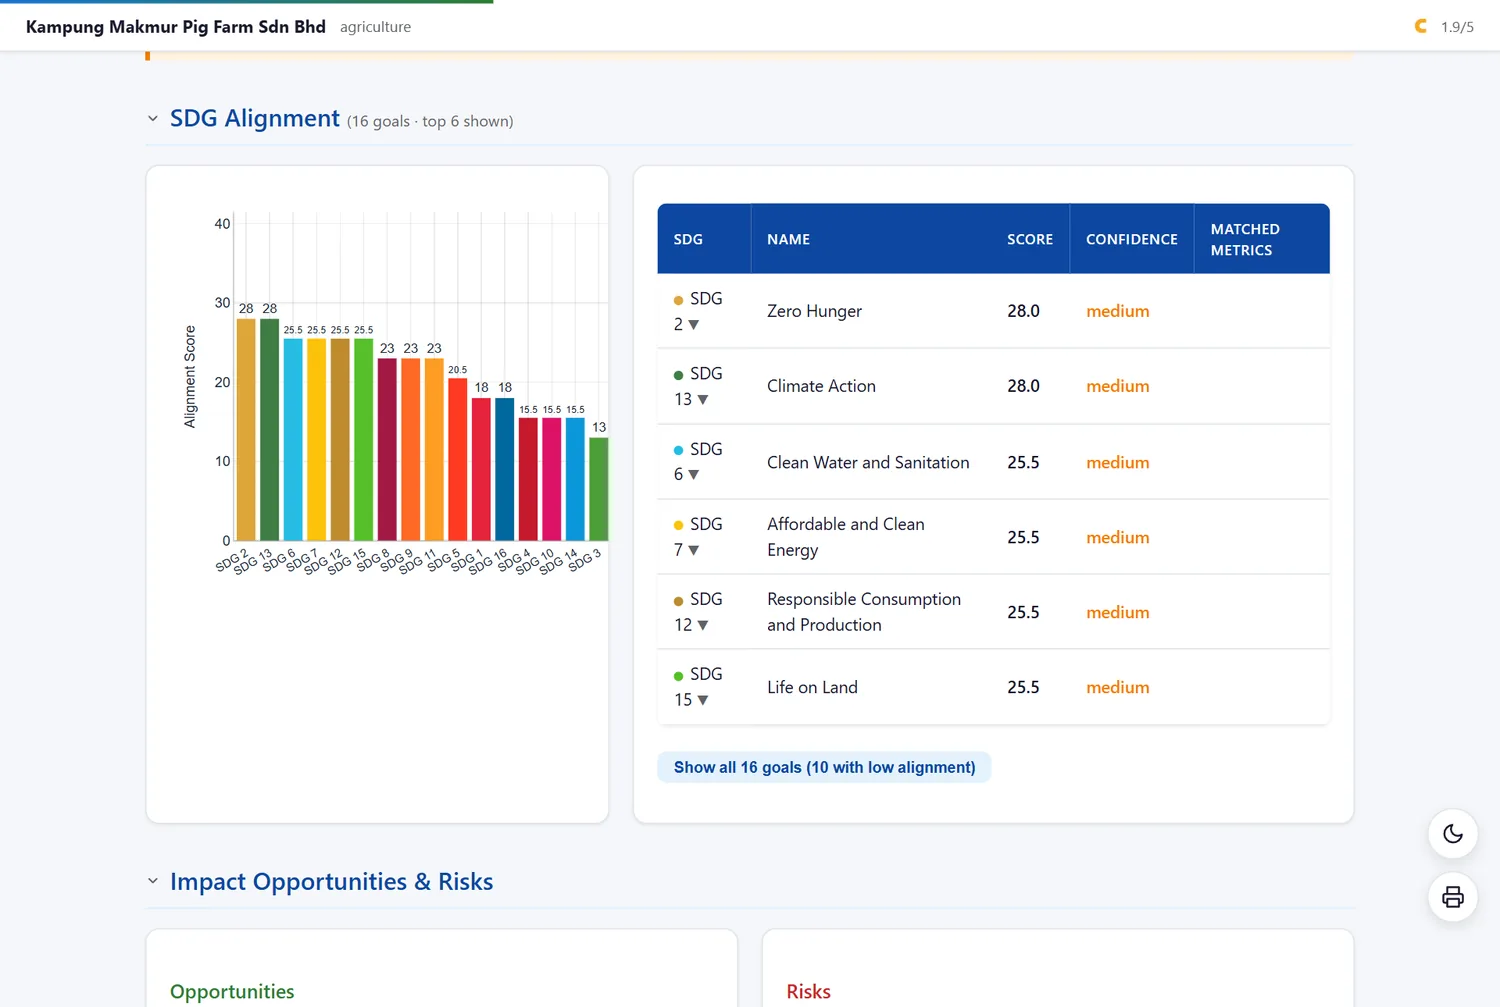
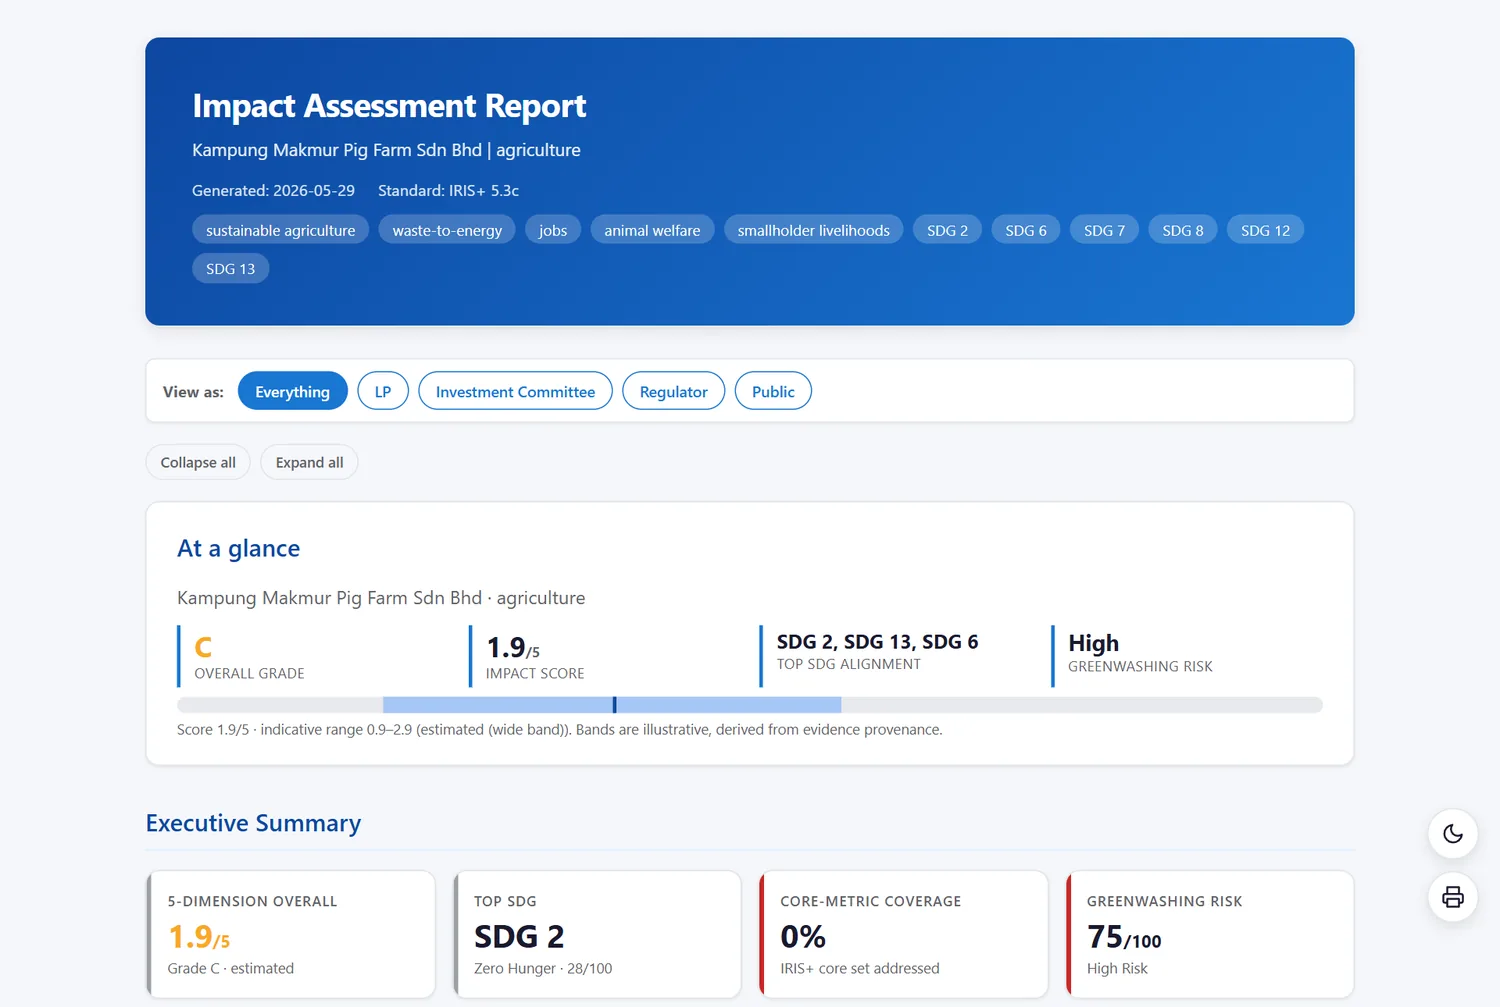
SDG alignment scoring
SDG alignment scoringPer-goal scores with the evidence chain behind each one, in official UN colours.
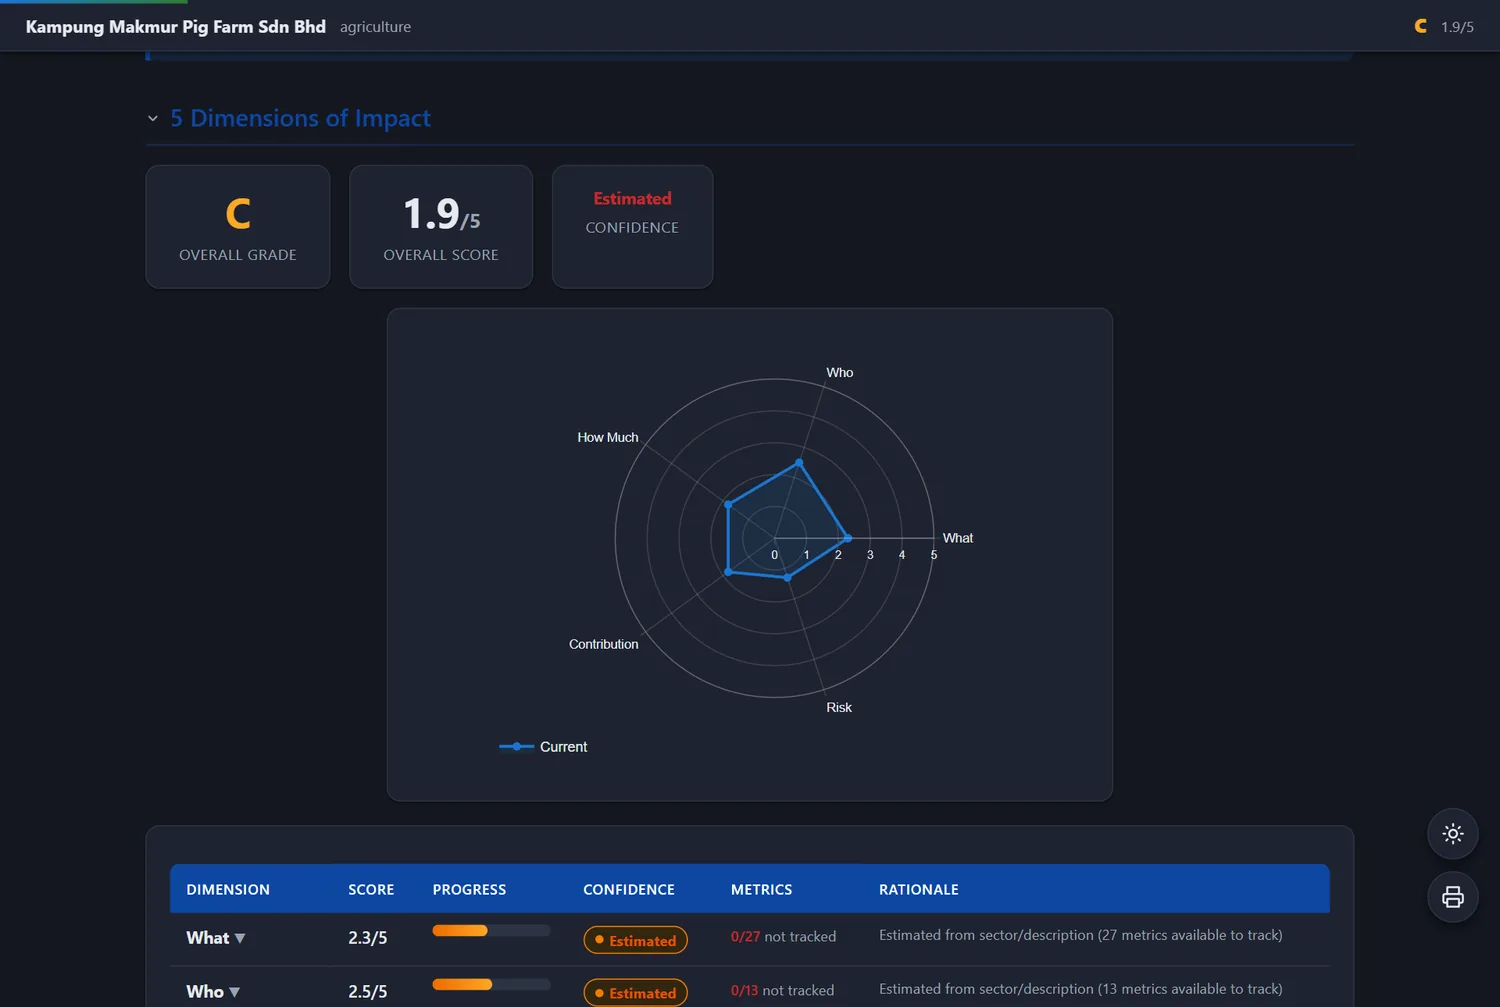
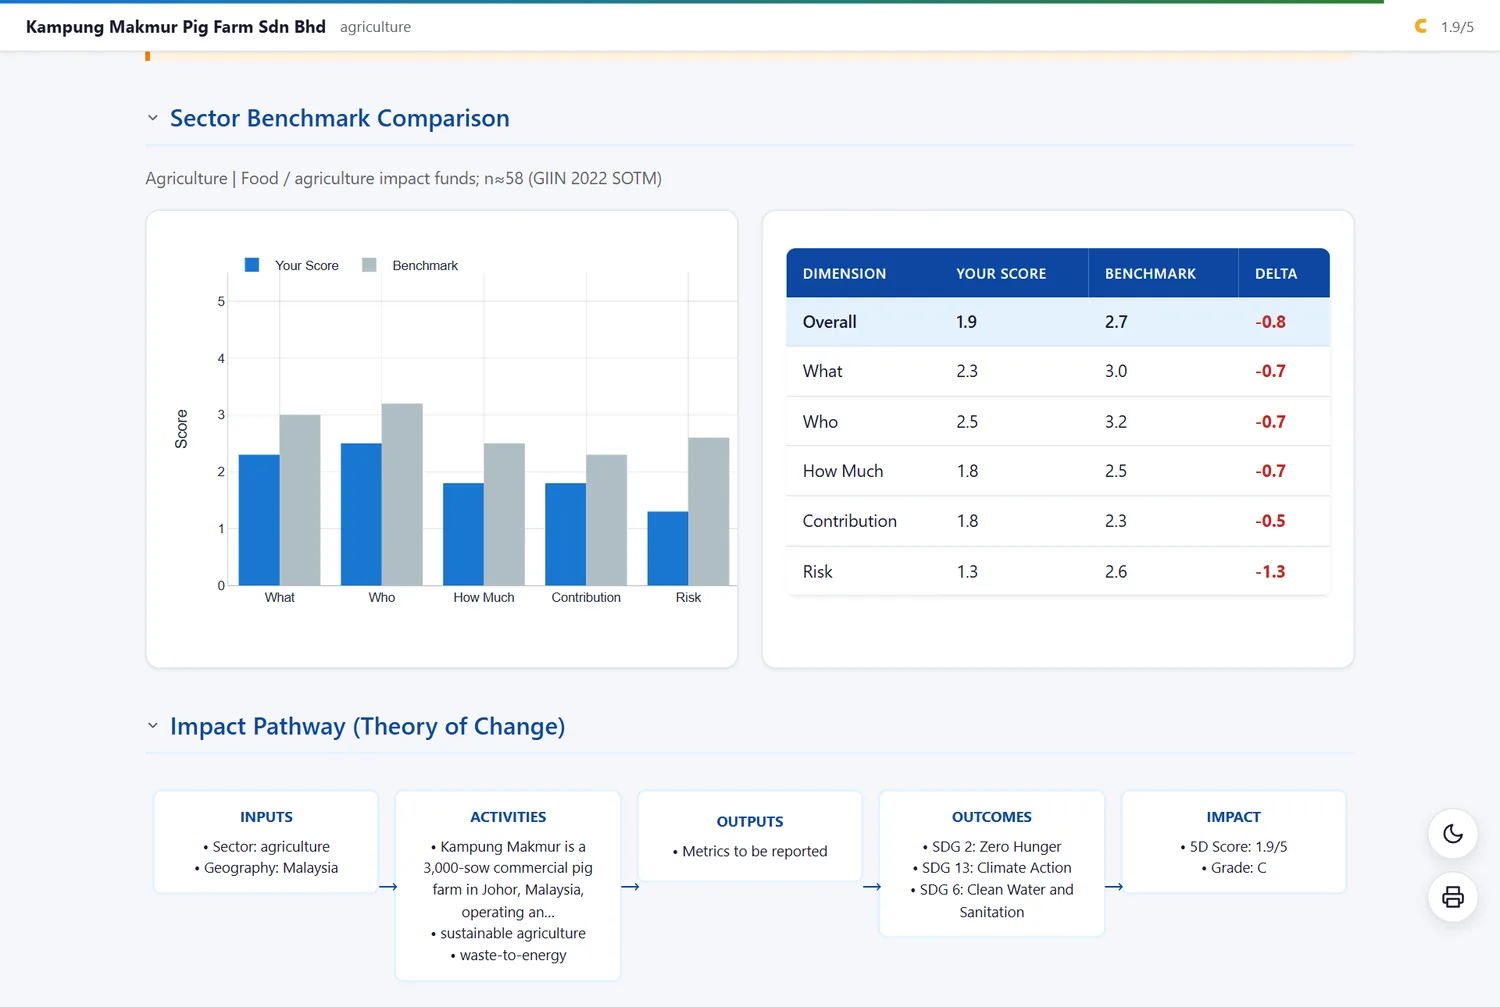
5-Dimension radar
5-Dimension radar
5-Dimension radarWhat, Who, How Much, Contribution, Risk — plotted against the sector benchmark.
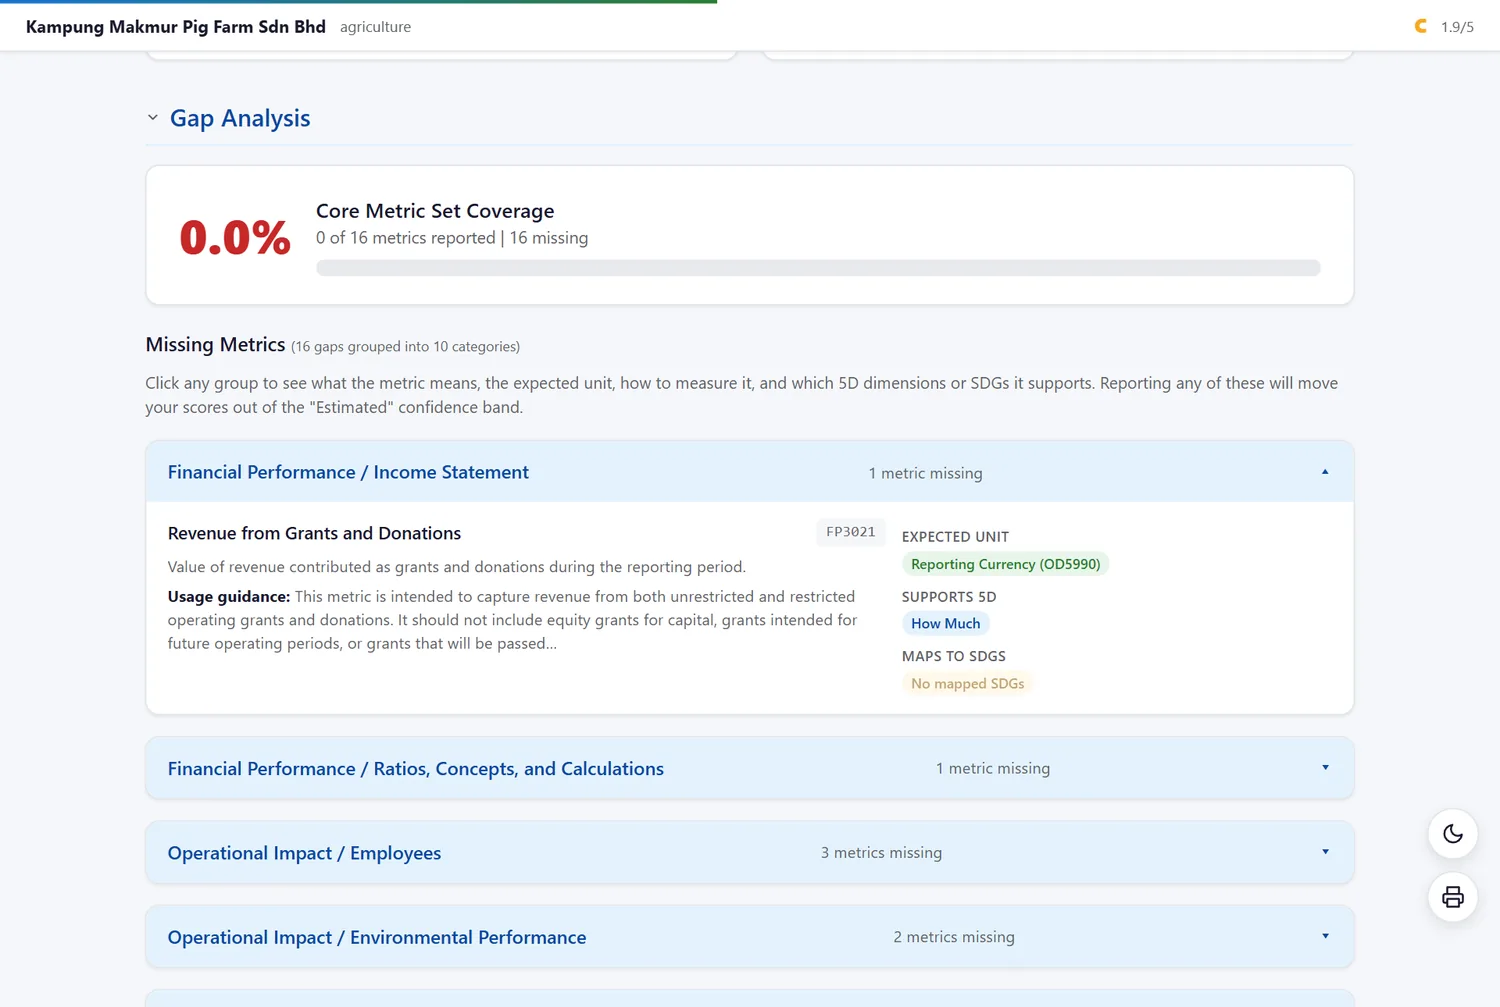
Metric gap analysis
Metric gap analysis
Metric gap analysisWhat the company measures versus what the IRIS+ Core Metric Set expects.
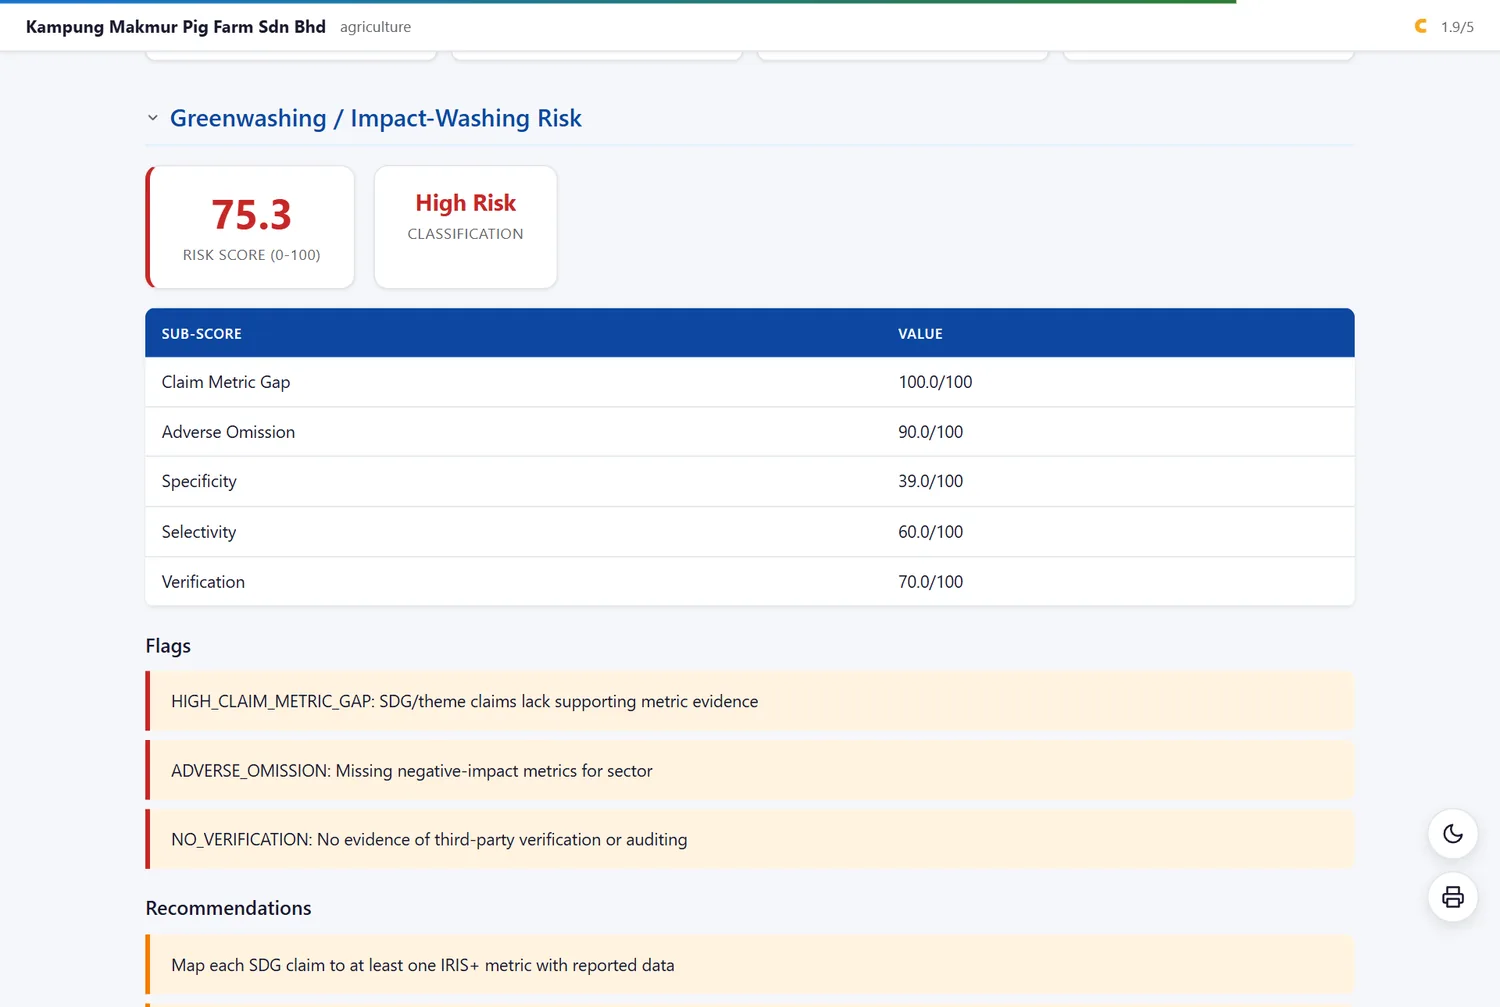
Greenwashing screen
Greenwashing screen
Greenwashing screenGAI and CTI with per-claim labels and severity you can quote back.
Sector benchmarking
Sector benchmarking
Sector benchmarkingGIIN survey data across 18 sectors, so a score has a peer group.
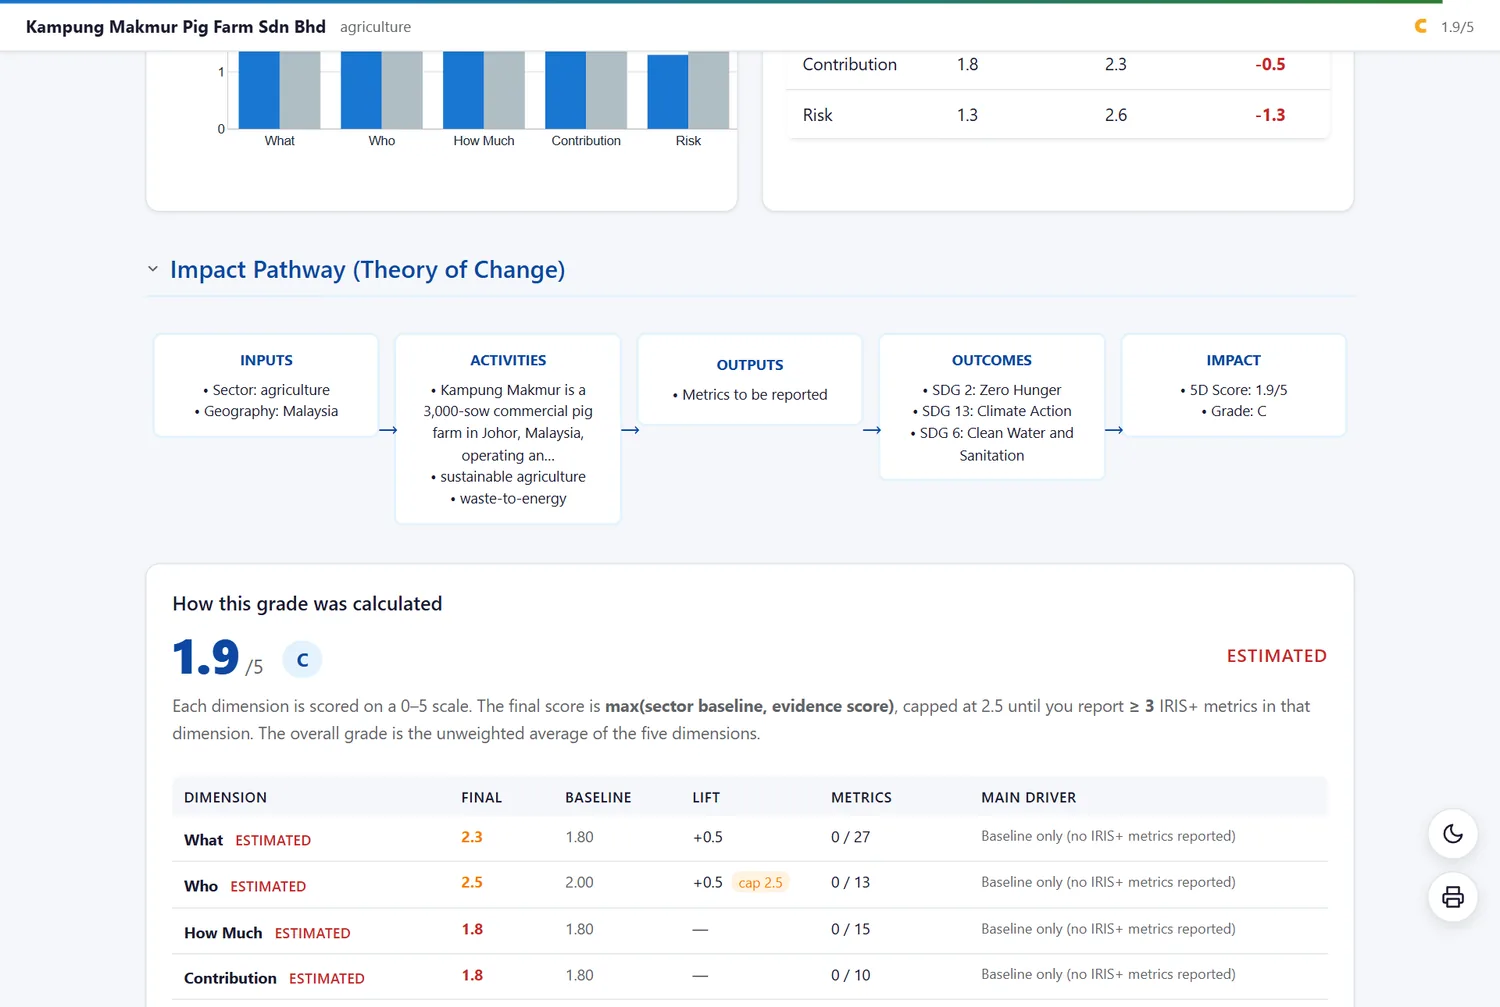
Methodology appendix
Methodology appendixEvery weighting and threshold disclosed in the report itself.

Illustrative only. The sample company, figures and scores are a demonstration case generated to exercise the toolkit. Nothing on this page is an investment recommendation, a due-diligence opinion, or an assessment of any real business.

Generate your own in one command.

Point it at a deck and it writes the same set of deliverables for your deal — locally, with no upload.